Visualizers
Visualizing a dependency parse or named entities in a text is not only a fun NLP demo – it can also be incredibly helpful in speeding up development and debugging your code and training process. That’s why our popular visualizers, displaCy and displaCy ENT are also an official part of the core library. If you’re running a Jupyter notebook, displaCy will detect this and return the markup in a format ready to be rendered and exported.
The quickest way to visualize Doc is to use
displacy.serve. This will spin up a simple
web server and let you view the result straight from your browser. displaCy can
either take a single Doc or a list of Doc objects as its first argument.
This lets you construct them however you like – using any pipeline or
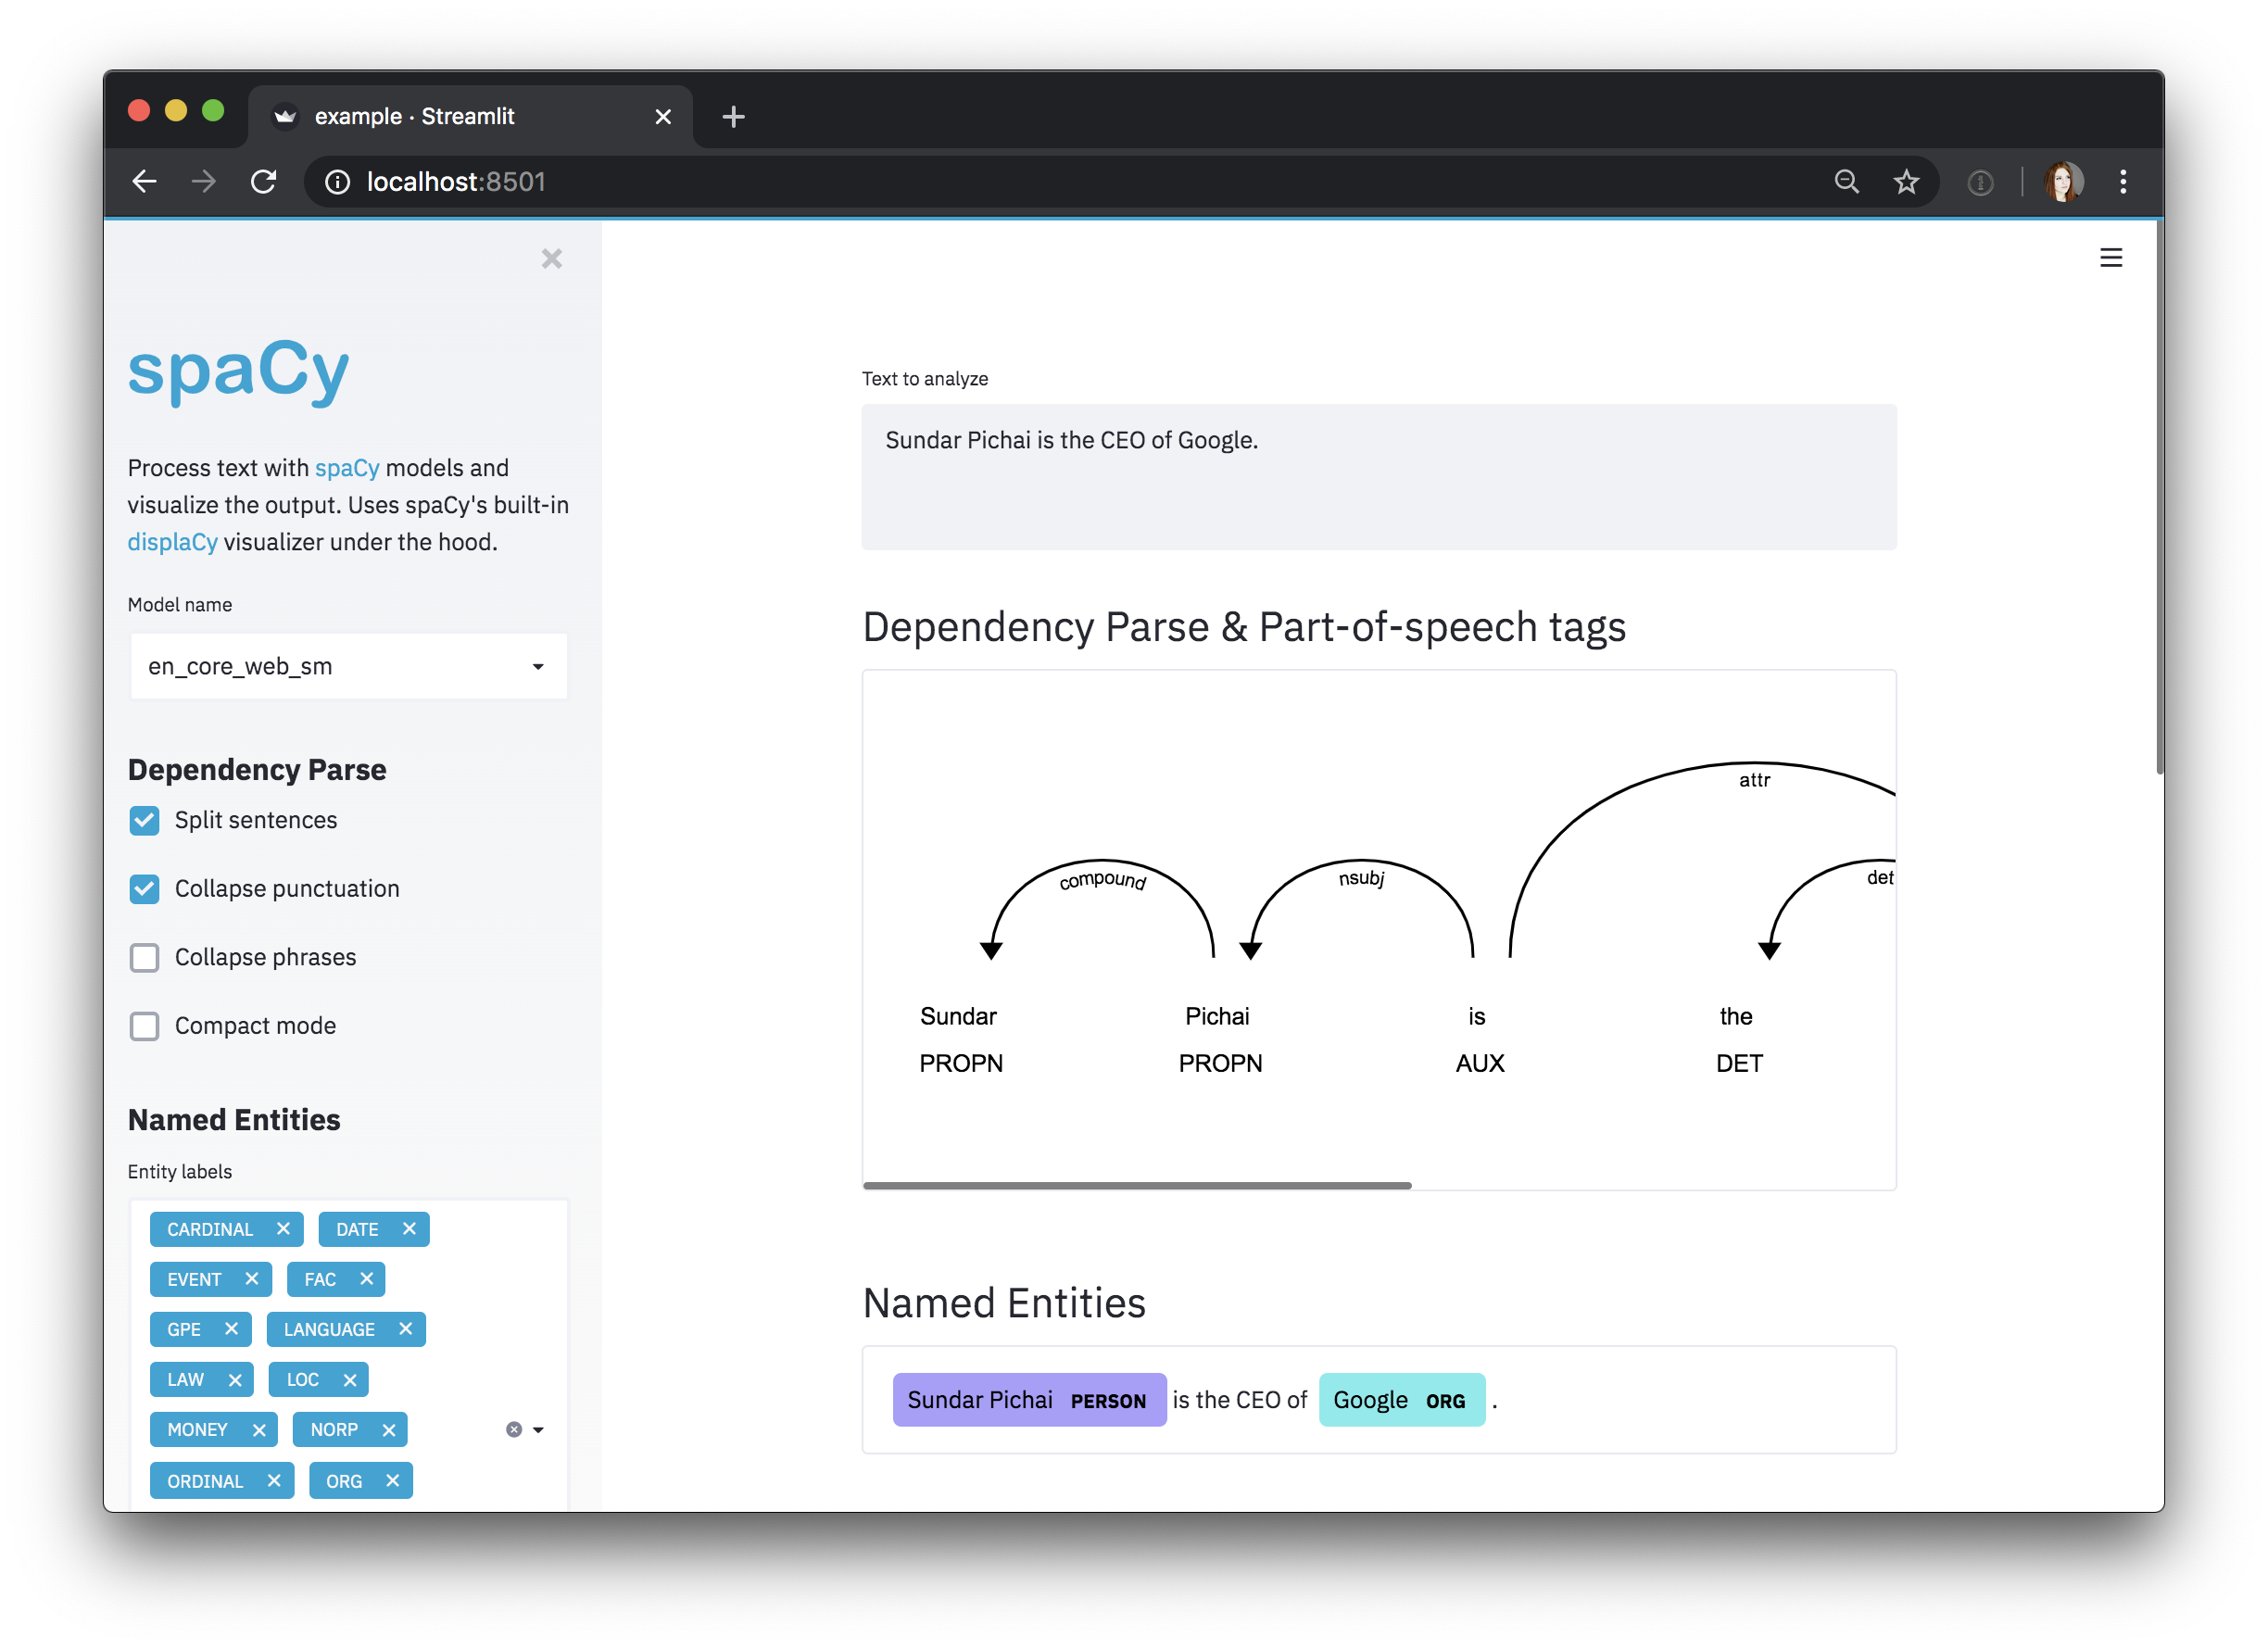
modifications you like. If you’re using Streamlit, check
out the spacy-streamlit
package that helps you integrate spaCy visualizations into your apps!
Visualizing the dependency parse
The dependency visualizer, dep, shows part-of-speech tags and syntactic
dependencies.
Dependency example

The argument options lets you specify a dictionary of settings to customize
the layout, for example:
| Argument | Description |
|---|---|
compact | “Compact mode” with square arrows that takes up less space. Defaults to False. bool |
color | Text color. Can be provided in any CSS legal format as a string e.g.: "#00ff00", "rgb(0, 255, 0)", "hsl(120, 100%, 50%)" and "green" all correspond to the color green (without transparency). Defaults to "#000000". str |
bg | Background color. Can be provided in any CSS legal format as a string e.g.: "#00ff00", "rgb(0, 255, 0)", "hsl(120, 100%, 50%)" and "green" all correspond to the color green (without transparency). Defaults to "#ffffff". str |
font | Font name or font family for all text. Defaults to "Arial". str |
offset_x | Spacing on left side of the SVG in px. You might need to tweak this setting for long texts. Defaults to 50. int |
For a list of all available options, see the
displacy API documentation.

Visualizing long texts
Long texts can become difficult to read when displayed in one row, so it’s often
better to visualize them sentence-by-sentence instead. As of v2.0.12, displacy
supports rendering both Doc and Span objects, as
well as lists of Docs or Spans. Instead of passing the full Doc to
displacy.serve, you can also pass in a list doc.sents. This will create one
visualization for each sentence.
Visualizing the entity recognizer
The entity visualizer, ent, highlights named entities and their labels in a
text.
Named Entity example
The entity visualizer lets you customize the following options:
| Argument | Description |
|---|---|
ents | Entity types to highlight (None for all types). Defaults to None. Optional[List[str]] |
colors | Color overrides. Entity types should be mapped to color names or values. Defaults to {}. Dict[str, str] |
If you specify a list of ents, only those entity types will be rendered – for
example, you can choose to display PERSON entities. Internally, the visualizer
knows nothing about available entity types and will render whichever spans and
labels it receives. This makes it especially easy to work with custom entity
types. By default, displaCy comes with colors for all entity types used by
trained spaCy pipelines. If you’re using custom entity types, you can
use the colors setting to add your own colors for them.
The above example uses a little trick: Since the background color values are
added as the background style attribute, you can use any
valid background value
or shorthand – including gradients and even images!
Adding titles to documents
Rendering several large documents on one page can easily become confusing. To
add a headline to each visualization, you can add a title to its user_data.
User data is never touched or modified by spaCy.
This feature is especially handy if you’re using displaCy to compare performance at different stages of a process, e.g. during training. Here you could use the title for a brief description of the text example and the number of iterations.
Visualizing spans
The span visualizer, span, highlights overlapping spans in a text.
Span example
The span visualizer lets you customize the following options:
| Argument | Description |
|---|---|
spans_key | Which spans key to render spans from. Default is "sc". str |
templates | Dictionary containing the keys "span", "slice", and "start". These dictate how the overall span, a span slice, and the starting token will be rendered. Optional[Dict[str, str] |
kb_url_template | Optional template to construct the KB url for the entity to link to. Expects a python f-string format with single field to fill in Optional[str] |
colors | Color overrides. Entity types should be mapped to color names or values. Dict[str, str] |
Because spans can be stored across different keys in doc.spans, you need to
specify which one displaCy should use with spans_key (sc is the default).
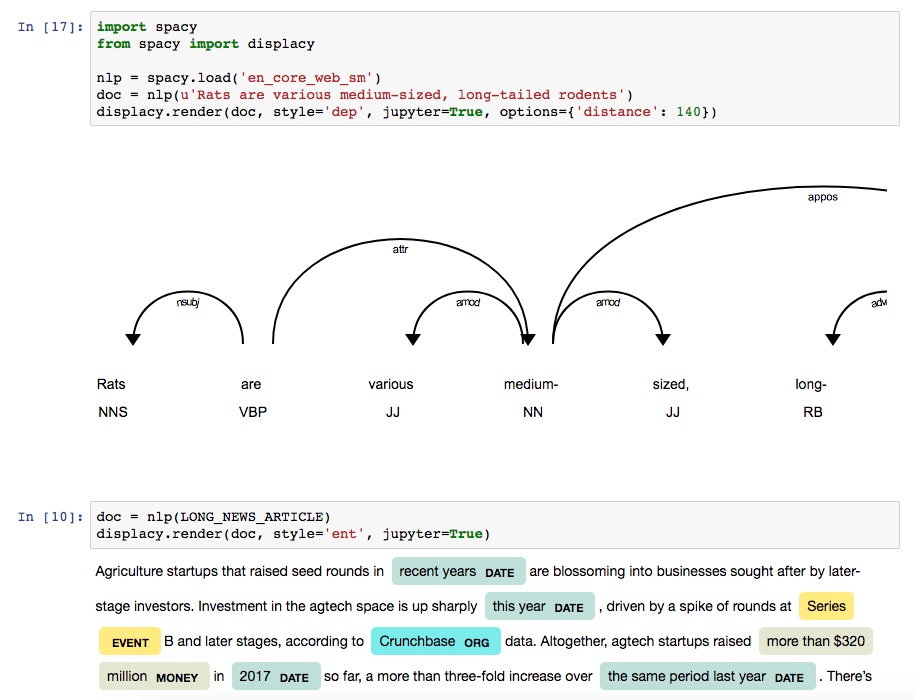
Using displaCy in Jupyter notebooks
displaCy is able to detect whether you’re working in a Jupyter notebook, and will return markup that can be rendered in a cell straight away. When you export your notebook, the visualizations will be included as HTML.
Jupyter example
Internally, displaCy imports display and HTML from IPython.core.display
and returns a Jupyter HTML object. If you were doing it manually, it’d look like
this:
Rendering HTML
If you don’t need the web server and just want to generate the markup – for
example, to export it to a file or serve it in a custom way – you can use
displacy.render. It works the same way, but
returns a string containing the markup.
Example
page=True renders the markup wrapped as a full HTML page. For minified and
more compact HTML markup, you can set minify=True. If you’re rendering a
dependency parse, you can also export it as an .svg file.
Example: Export SVG graphics of dependency parses
Example
The above code will generate the dependency visualizations as two files,
This-is-an-example.svg and This-is-another-one.svg.
Rendering data manually
You can also use displaCy to manually render data. This can be useful if you
want to visualize output from other libraries, like NLTK
or
SyntaxNet.
If you set manual=True on either render() or serve(), you can pass in data
in displaCy’s format as a dictionary (instead of Doc objects). There are
helper functions for converting Doc objects to
displaCy’s format for use with
manual=True: displacy.parse_deps,
displacy.parse_ents, and
displacy.parse_spans.
DEP input
ENT input
ENT input with knowledge base links
SPANS input
Using displaCy in a web application
If you want to use the visualizers as part of a web application, for example to
create something like our online demo,
it’s not recommended to only wrap and serve the displaCy renderer. Instead, you
should only rely on the server to perform spaCy’s processing capabilities, and
use a client-side implementation like
displaCy.js to render the
JSON-formatted output.
Alternatively, if you’re using Streamlit, check out the
spacy-streamlit package that
helps you integrate spaCy visualizations into your apps. It includes a full
embedded visualizer, as well as individual components.